BC Speculation tax details


Ministry of Finance

Tax Information Sheet

ISSUED: February 2018 REVISED: March 2018 Information Sheet 2018-001

gov.bc.ca/propertytaxes

B.C. Speculation Tax

Urban centres throughout the province are in a housing crisis. Rents and home prices have surged past local incomes and, in many communities, vacancy rates sit close to 0%.

Speculation has contributed to runaway prices and made it difficult for British Columbians to find a home they can afford. This is hurting people, businesses and communities.

The speculation tax works to ensure that British Columbians can afford to live in their own province. It will push speculators out of the housing market, and help turn vacant and underutilized properties back into homes for people who live and work in our province. The tax will work to increase the supply of available housing in designated urban centres, helping to ensure our teachers, carpenters and small business owners can live where they work.

The tax is designed to capture foreign and domestic speculators, satellite families who live in B.C. but do not pay their share of income taxes, as well as homeowners who hold vacant property in designated urban centres. Over 99% of British Columbians are estimated to be exempt, because they will not have a vacant second home in the affected areas.

Implementation details:

Focus on urban centres:

The speculation tax applies to residential property in British Columbia’s largest urban centres facing the housing affordability crisis. These are regions with low vacancy rates that are facing severe affordability challenges in which home prices drastically exceed local incomes.

The tax applies in the Metro Vancouver Regional District (excluding Bowen Island and Electoral Area A, except the part of the electoral area that is the UBC and University Endowment Lands), the Capital Regional District (excluding the Gulf Islands and

PO Box 9427 Stn Prov Gov Victoria BC V8W 9V1

Juan de Fuca), Kelowna-West Kelowna, Nanaimo-Lantzville (excluding Protection Island), Abbotsford, Chilliwack, and Mission. Most islands are excluded.

Map of areas the speculation tax applies to:

Speculation tax map

Exemptions:
Primary residences of British Columbians are exempt from the tax.

Properties that are used as qualifying long-term rentals are exempt from the tax. Homes will need to be rented out for at least three months to qualify for an exemption in 2018. Starting in 2019, homes will need to be rented out for at least six months, in increments of 30 days or more, to qualify for an exemption.

Over 99% of British Columbians will be exempt, because the vast majority of homes owned by British Columbians in the province’s urban centres will either be owner- occupied or will be rented long-term.

Rate design:

In 2018, the tax rate for all properties subject to the tax is 0.5% on the property value.

In 2019 and subsequent years, the tax rates will be as follows:

  • 2% for foreign investors and satellite families;
  • 1% for Canadian citizens and permanent residents who do not live in BritishColumbia; and
  • 0.5% for British Columbians who are Canadian citizens or permanent residents(and not members of a satellite family). Credit design:British Columbians who are Canadian citizens or permanent residents, and not part of a satellite family, will be eligible for a tax credit that is immediately applied against the speculation tax. This credit will offset a total of $2,000 in speculation tax payable. For homeowners with multiple properties, the tax credit will only apply to one property.

    This tax credit will ensure that British Columbians do not pay tax on a second home valued up to $400,000. For more expensive vacant properties, the credit ensures that tax only applies to the value of the property above $400,000.

Speculation Tax Page 2 of 4

Who doesn’t pay the tax:

The vast majority of British Columbians:

Over 99% of British Columbians are estimated to be exempt from the speculation tax because they own a home and live in it, rent a home, have a second property that is outside of a designated urban centre, have a second property that is valued below $400,000 or have multiple urban properties that are rented out long-term.

People whose homes and cottages are outside the designated urban centres:

The speculation tax uses a targeted approach. It is purposefully designed to help bring housing stock onto the market in B.C.’s urban centres hit hardest by the housing crisis. People with homes and cottages outside the designated area do not pay the speculation tax.

Homeowners with properties in designated urban centres, but who rent them out long-term:

People who hold properties in designated urban centres will also be exempt from the tax if they rent the properties out at least six months a year.

Those eligible for special exemptions:
There will be exemptions to accommodate special circumstances, including:

  • The owner or tenant is undergoing medical care or residing in a hospital, long- term care or a supportive-care facility
  • The owner or tenant is temporarily absent for work purposes
  • The registered owner is deceased and the estate is in the process of beingadministeredWho pays the tax:

    Foreign speculators and satellite families:

    Foreign demand and capital continue to put pressure on B.C.’s housing stock. Foreign owners and satellite families — households with high worldwide income that pay little income tax in B.C. — will be captured by the tax and will not be eligible for a primary residence exemption.

Speculation Tax Page 3 of 4

Foreign owners and satellite families can avoid the tax by renting their property. They will be able to offset a portion of the speculation tax with a non-refundable tax credit if they report income in B.C.

Domestic speculators:

British Columbians deserve to be able to afford a home, whether renting or owning, in their own province. The speculation tax primarily targets non-residents who own properties in designated urban centres and who do not rent them out at least six months a year.

Canadians who keep their primary residence in another province can avoid the tax by renting out their B.C. property for six months of the year. They will be able to offset a portion of the speculation tax with a non-refundable tax credit if they report income in B.C.

Those with multiple properties in B.C.’s designated cities that are vacant most of the year:

When a property owner holds onto vacant homes and benefits from rising property value, that is speculation. This behaviour is taking homes out of the housing market, driving vacancy rates lower, and making it harder for British Columbians to find a place to live.

Those who own multiple properties in urban centres that they opt to not rent out or live in will be captured by the tax. British Columbians with vacant property in urban centres will be eligible for a non-refundable tax credit that offsets a total of $2,000 in speculation tax payable and is immediately applied against the speculation tax owing. For homeowners with multiple properties, the tax credit will only apply to one property.

Speculation Tax Page 4 of 4

Building Permits


February 7, 2018

The value of building permits grew 27.3% (seasonally adjusted) in December from the previous month. Increases in permits for residential (+50.6) and industrial (+12.8%) projects offset decreases for institutional (‑36.3%) and commercial (‑13.5%) buildings. The value of permits rose in Vancouver (+38.9%), where most of the province’s building activity occurs, while Abbotsford-Mission (+167.1%) and Victoria (+69.2%) both saw large increases as well. Kelowna (‑31.6%) saw a decrease in the value of permits issued.

Nationally, building permits increased by 4.8% in December. There was growth in Saskatchewan (+31.5%), British Columbia (+27.3%), and Quebec (+20.6%). Conversely, the value of permits contracted in Manitoba (‑25.4%), Alberta (‑10.5%), and Atlantic Canada (‑5.4%).

Regional Building Permits

Through December of 2017, the value of building permits issued in the province’s regions climbed 17.5% (unadjusted) above the level recorded in the same period last year. Investment intentions were up in most regions ranging from 7.3% in Kootenay to 156.0% in Nechako. Planned spending rose in Mainland/Southwest (+16.8%), where increases were seen for institutional and governmental (+64.9%), industrial (+60.2%), commercial (+17.2%), and residential (+12.2%) projects. Overall permits continued to increase in North Coast (+79.6%), Thompson/Okanagan (+23.4%), and Vancouver Island/Coast (+22.3%), while the only regions to see declines were Northeast (‑30.3%) and Cariboo (‑9.8%).

Data Source: Statistics Canada (Regional data produced by BC Stats from unpublished data)

Housing starts


 March 9, 2018

Housing starts in urban areas (areas with population of at least 10,000) in British Columbia fell by 26.1% (seasonally adjusted at annual rates) in February compared to January. The decrease was widespread with every housing type start registering declines in the month.

Across British Columbia’s census metropolitan areas, Victoria (+175.5%) was the only one in which housing starts grew in February. Kelowna saw the biggest decrease at 64.5% for the month.

Despite falling in half of the provinces, urban housing starts across Canada went up (+7.1%) in February. The increase was led by Prince Edward Island (+184.6%), Ontario (+25.8%) and Quebec (+17.2%). The increase was concentrated in apartment units (+22.8%) with all other housing types starts declining in the month. Saskatchewan (‑40.0%) registered the largest housing starts decline in February.

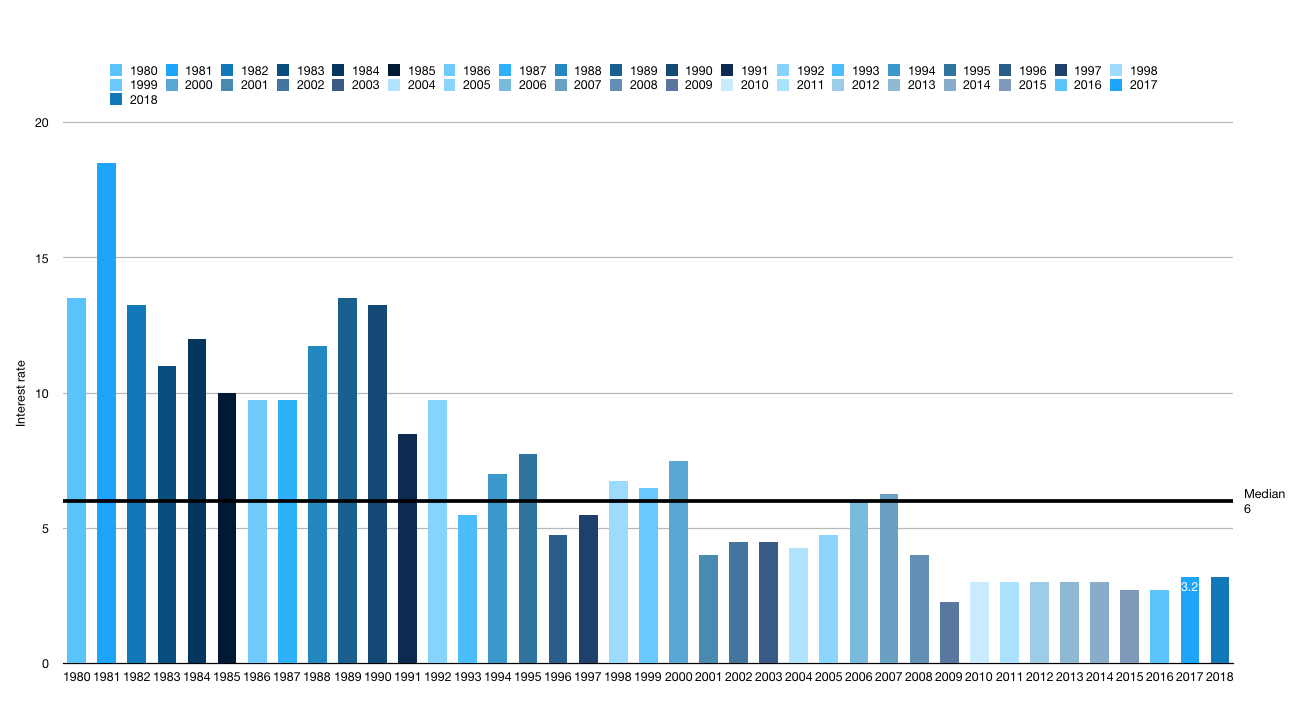
Canadian historical interest rates 1980-2018


I always find it insightful to look at where we have been. This graph illustrates the interest rate landscape of the past, nearly, 40 years. (as represented by the prime lending rate, mortgage rates have indeed been higher & lower)

right click on image to open larger format in new window.

Free markets & the Politician


Recent times have shown the inadvisability of politicians getting involved in changing markets.

In fact, I would suggest politicians should stay away from free markets, or those with heretofore limited regulation, if we want them to remain as such.

Measures taken (never timely) simply add layers of distortion. Dismantled with great difficulty at some future date when unintended consequences mount or the inflation of previous action becomes too much to bear.

The real estate market in Vancouver was naturally correcting going into the summer of 2016. Meanwhile the BC Liberals, in their infinite wisdom decide to implement a punitive 15% tax on homes purchased in the Greater Vancouver area by foreign nationals. Largely a knee jerk reaction to popular outcry. Globally, this tax was viewed as an assault on wealthy foreign nationals, not as an effective measure against rising house prices.

Managing to tax an already cooling market is one thing… alienating and offending an entire segment of the population is another. I would think it’s unwise. We will never know what the natural peak for housing prices was going to be in the Great Vancouver Area, but had it occurred, the effects would have sent an appropriate signal to investors and a cooling phase would gain strength from organic feedback.

Now we have a new & opposite form of distortion in the market; the government will step in and provide interest free loans (*be sure to read the fine print) up to $37,500 for folks that cannot afford a healthy downpayment. Does this not compound the housing affordability issue? Instead of letting the market ebb and flow, rise and fall of its own weight, we prop up and cajole.

Don’t get me wrong, I love to see my homes’ value rise, but millions of consumers’ maturation patterns are being impeded by a single and fundamental aspect of life – shelter. Contrary to popular belief, the political meddling needs to stop. Let the market take it’s course.

Debt is debt. This lovely gift from the Liberals is more debt. Plain and simple. Once again, the onus will be on the borrower, inflated by the government and backstopped by you, the tax-payer. The 6 big banks of Canada’s lending monopoly won’t hurt equitably when this unravels. Sure their dividends will decrease but they will repossess, repackage and write off. Meanwhile, an entire generation of freshly leveraged up, tired-of-going-nowhere-millennials, will feel the sting for the next decade with their underwater mortgages, foreclosures & bankruptcies.

Market cycles have a cleansing effect over time, separating the weak from the strong. When the fundamentals are stunted or encouraged you create incalculable & amplified crisis. Meddling with the natural process eliminates the chance for rebirth, for healthy growth and true long term stability. We want ebb & flow… we don’t want crisis.

— Stability does not equal the absence of volatility, volatility is necessary —

We need politicians with backbones strong enough to tell the public, you reap what you sow. Politicians strong enough to see their powerful & aging friends, lose money. Politicians with enough patience to not distort markets for votes, when the wave of consequence is sure to last decades. With enough presence of mind to see that the average citizen can find their own way into crippling debt without government encouragement.

If we can’t achieve this, we can rest assured that the next crisis will be larger than the last.

Buyers have a serious advantage in the winter months! If you’re into that sort of thing…


It might seem counter-intuitive, but moving in the winter—from house-hunting to getting all your worldly belongings from point A to point B—can actually be easier, cheaper and more convenient than any other time of the year. Here’s why it pays to move during the colder months.

Canada vs. US home price comparisons


The price of homes in Canada’s largest cities varies significantly less than south of the border, where Americans face an average anywhere from $86,000 to $3.3 million, new data suggests.

The data was released Thursday by RentSeeker.ca, one of Canada’s largest real estate websites, and was created with information released by the Canada Mortgage and Housing Corporation and the Canadian Real Estate Association.

Unsurprisingly, the average cost of a home in Canada this year was highest in Metro Vancouver, at $864,556. To afford a home in that range, Canadian families must bring home an annual salary of approximately $140,000.

  • Based on the latest census, the median family income in Canada is $78,870. The infographic suggests that those earning the median income can afford a house priced between $460,000 and $490,000 – slightly more than half of the cost of the average home price in Metro Vancouver.

Outside of Vancouver, the next most expensive Canadian market analyzed is in Kelowna ($785,415), followed by Toronto ($755,755). Abbotsford is fourth, and Victoria is Canada’s sixth-most expensive city based on average home price.

While the prices seem high, a move to some cities south of the border would cost homeowners even more. For sake of comparison, the below prices are listed in Canadian dollars (see note below for more information on conversion).

Just south of Vancouver, the average home price in Seattle is approximately $977,000.

The most expensive city in the U.S. that RentSeeker looked at is Saratoga, Calif., where the median home price is $3,305,158.

Recent statistics from the U.S. list the average annual household income as approximately $72,000. A family bringing in the median annual income could afford a home between $398,000 and $440,000.

The top five most expensive Canadian and American markets are as follows:

  1. Vancouver – $864,556; Saratoga, Calif. – $3,305,158
  2. Kelowna, B.C. – $785,415; San Francisco, Calif. – $2,252,319
  3. Toronto – $755,755; San Jose, Calif. – $1,362,990
  4. Abbotsford, B.C. – $753,939; Brooklyn, N.Y. – $1,074,474
  5. Mississauga, Ont. – $640,108; Seattle, Wash. – $978,136

But heading south could also save Canadians some money, depending on where they chose to live. In some cities, like Detroit, the median home price is as low as $86,356.

The average home price in the Las Vegas area is only $377,934 Canadian.

The least expensive medians of the cities looked at are as follows:

  1. Fredericton – $159,370; Detroit, Mich. – $86,356
  2. Moncton, N.B. – $235,961; Memphis, Tenn. – $213,219
  3. Trois-Rivieres, Que. – $248,503; Columbus, Ohio – $246,127
  4. Sherbrooke, Que. – $251,387; Oklahoma City, Okla. – $263,562
  5. Winnipeg – $284,799; Indianapolis, Ind. – $273,096

RentSeeker looked at a sample of cities across Canada and the U.S. based on highest populations but did not list costs in the Canadian territories because the information was not readily available through the CMHC.

Canadian prices in the infographic are in Canadian dollars, and American prices are listed in U.S. dollars. For the sake of comparison, all U.S. prices have been converted to Canadian dollars in the article above, based on an exchange rate of US$0.74 per C$1 as of Thursday afternoon. Prices have not been converted in the infographic below.

The above story has been edited to reflect that the Vancouver housing price is an average of all types of homes across the Metro Vancouver area. A previous version of this article stated incorrectly that the price was the median for detached homes only.

Affordability in Canada


This report, provided by the Conference Board of Canada & described as, “A new vision for housing in Canada” gets to the point of housing affordability. It’s worth the read, even a glance.

South Okanagan historical sales volume


The best way to figure out where we are headed sometimes is to look in the review mirror. Where have we been? This is a look at the total volume of transactions back to 1980. 

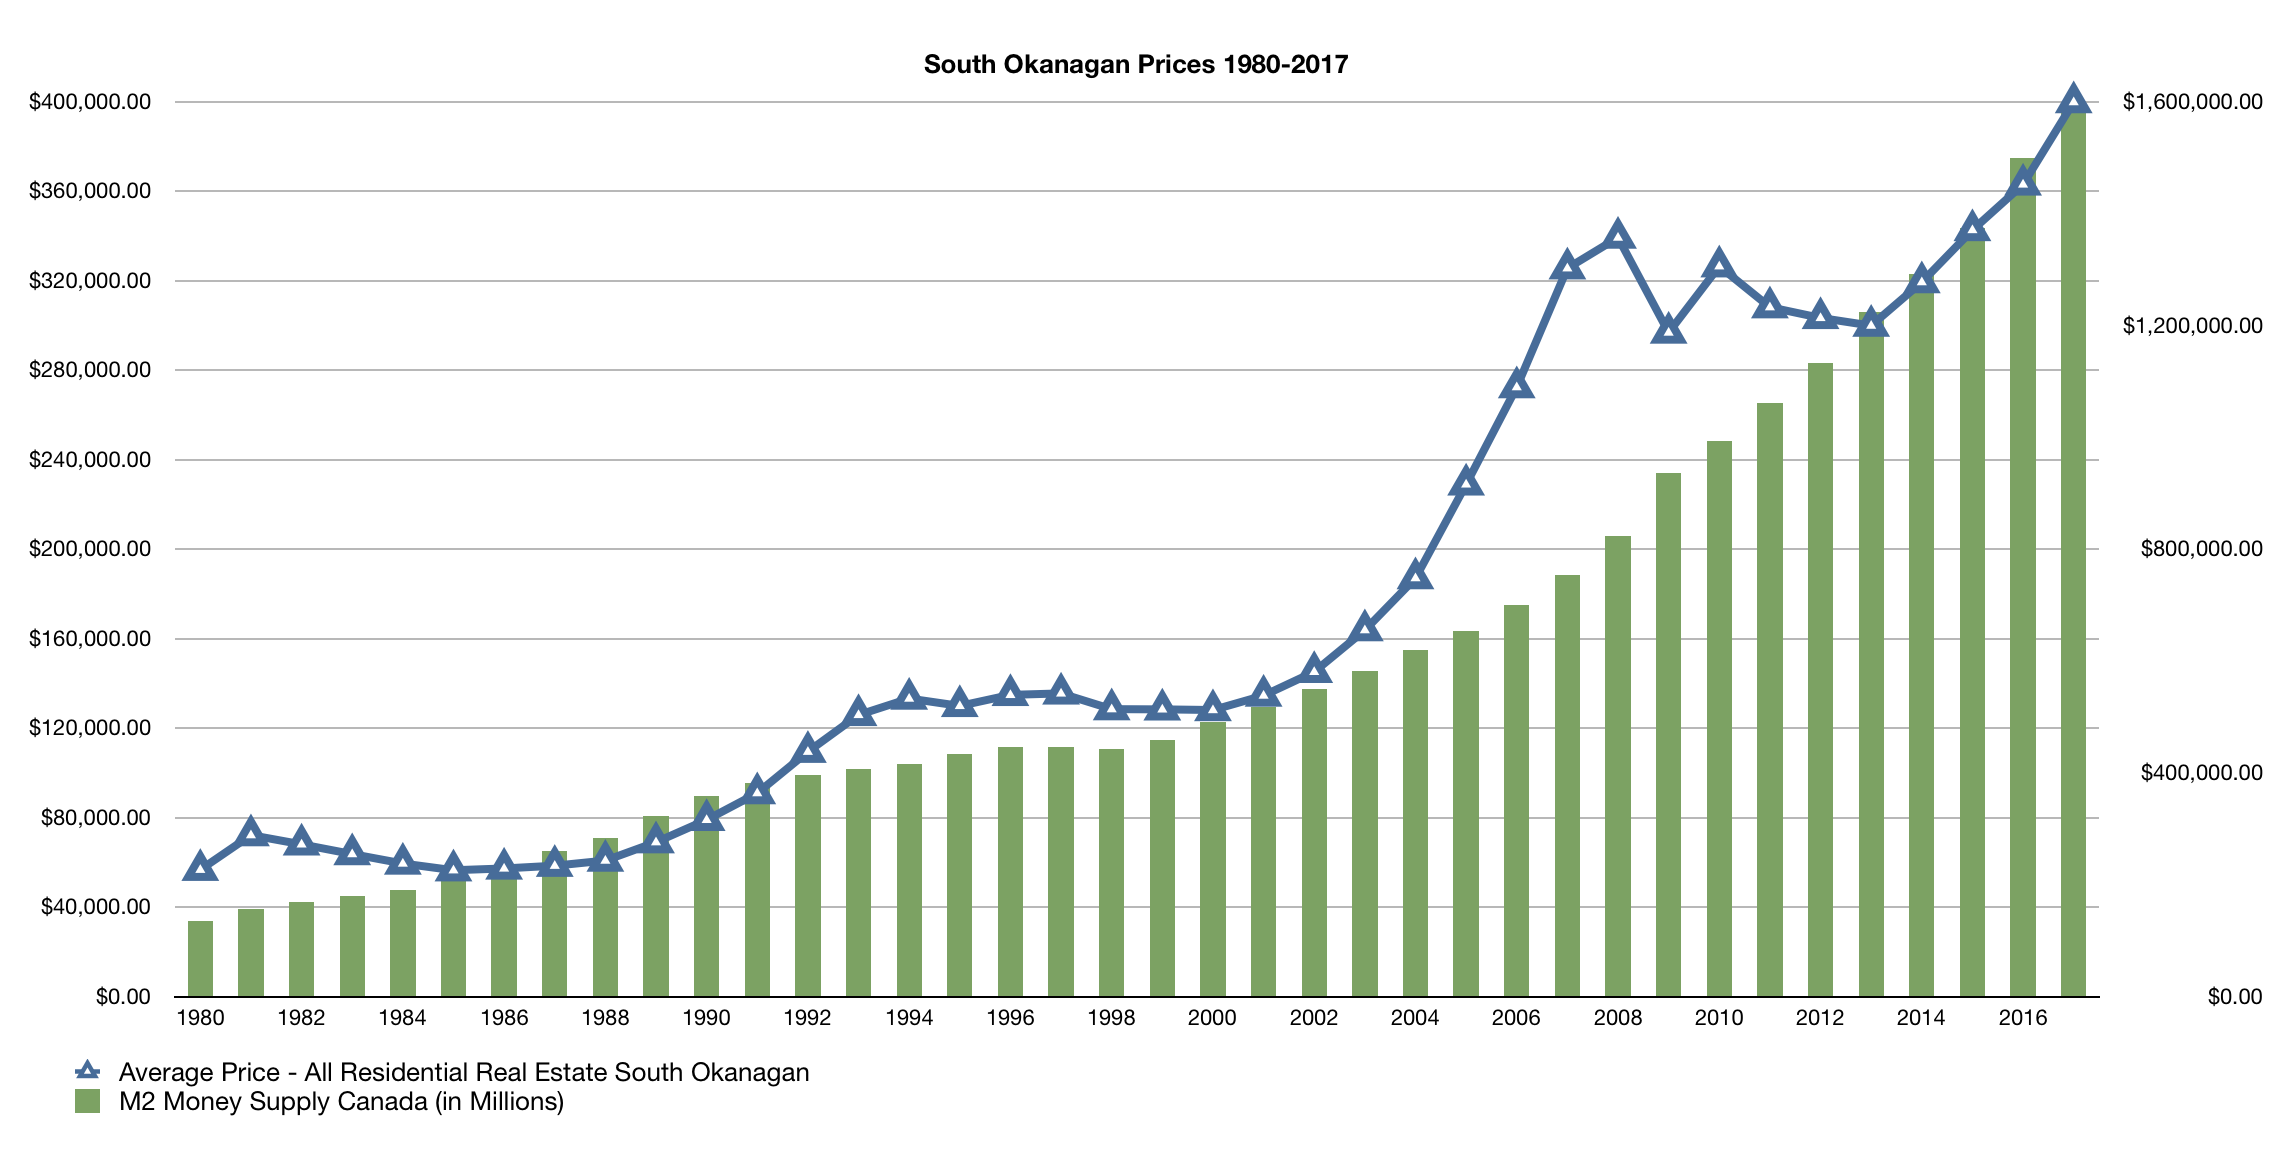
South Okanagan historical real estate prices


Here are historical real estate prices for the South Okanagan dating back to 1980. It gives perspective to how out of control things got leading up to 2008 & what has ensued since!

Also included in the graph is the M2 money supply of Canada, which is the broadest measurement of money circulating in Canada & a good indicator of inflation. I believe, this tends to correlate well with backstopping real estate prices, as can be seen in the graph. We have advanced significantly from 2013…

I hope you find this informative! (For larger image, right click and select open in new window)

1 2 3 4 5 6