The best way to figure out where we are headed sometimes is to look in the review mirror. Where have we been? This is a look at the total volume of transactions back to 1980. 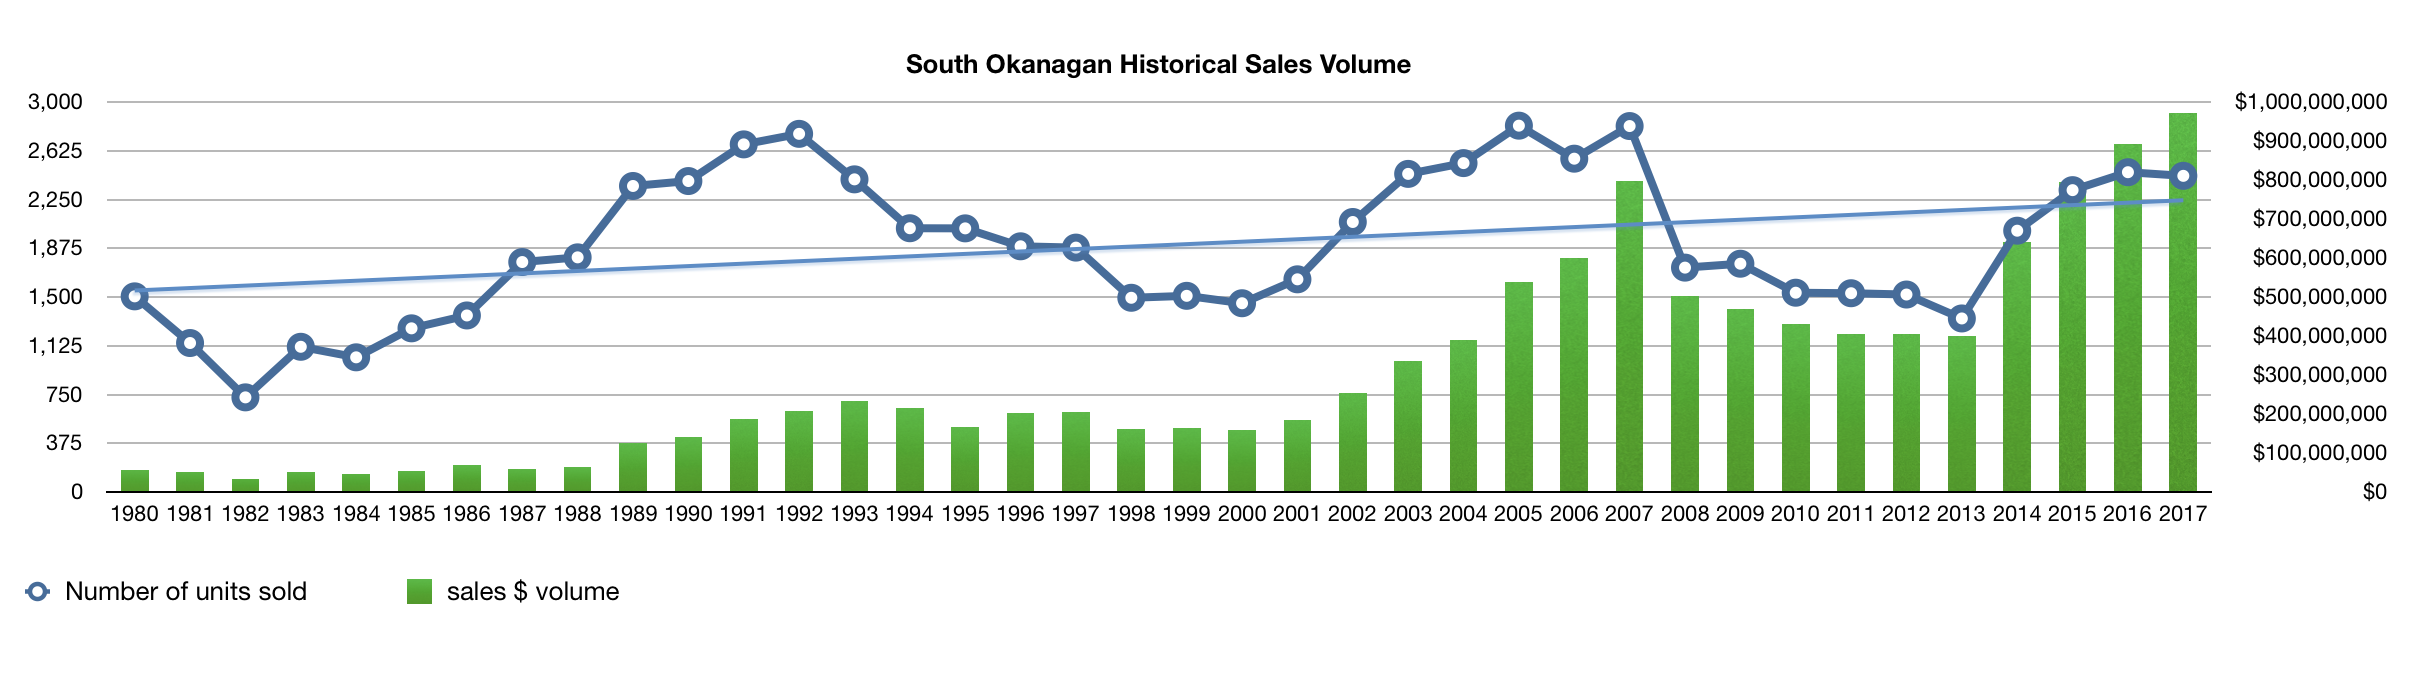
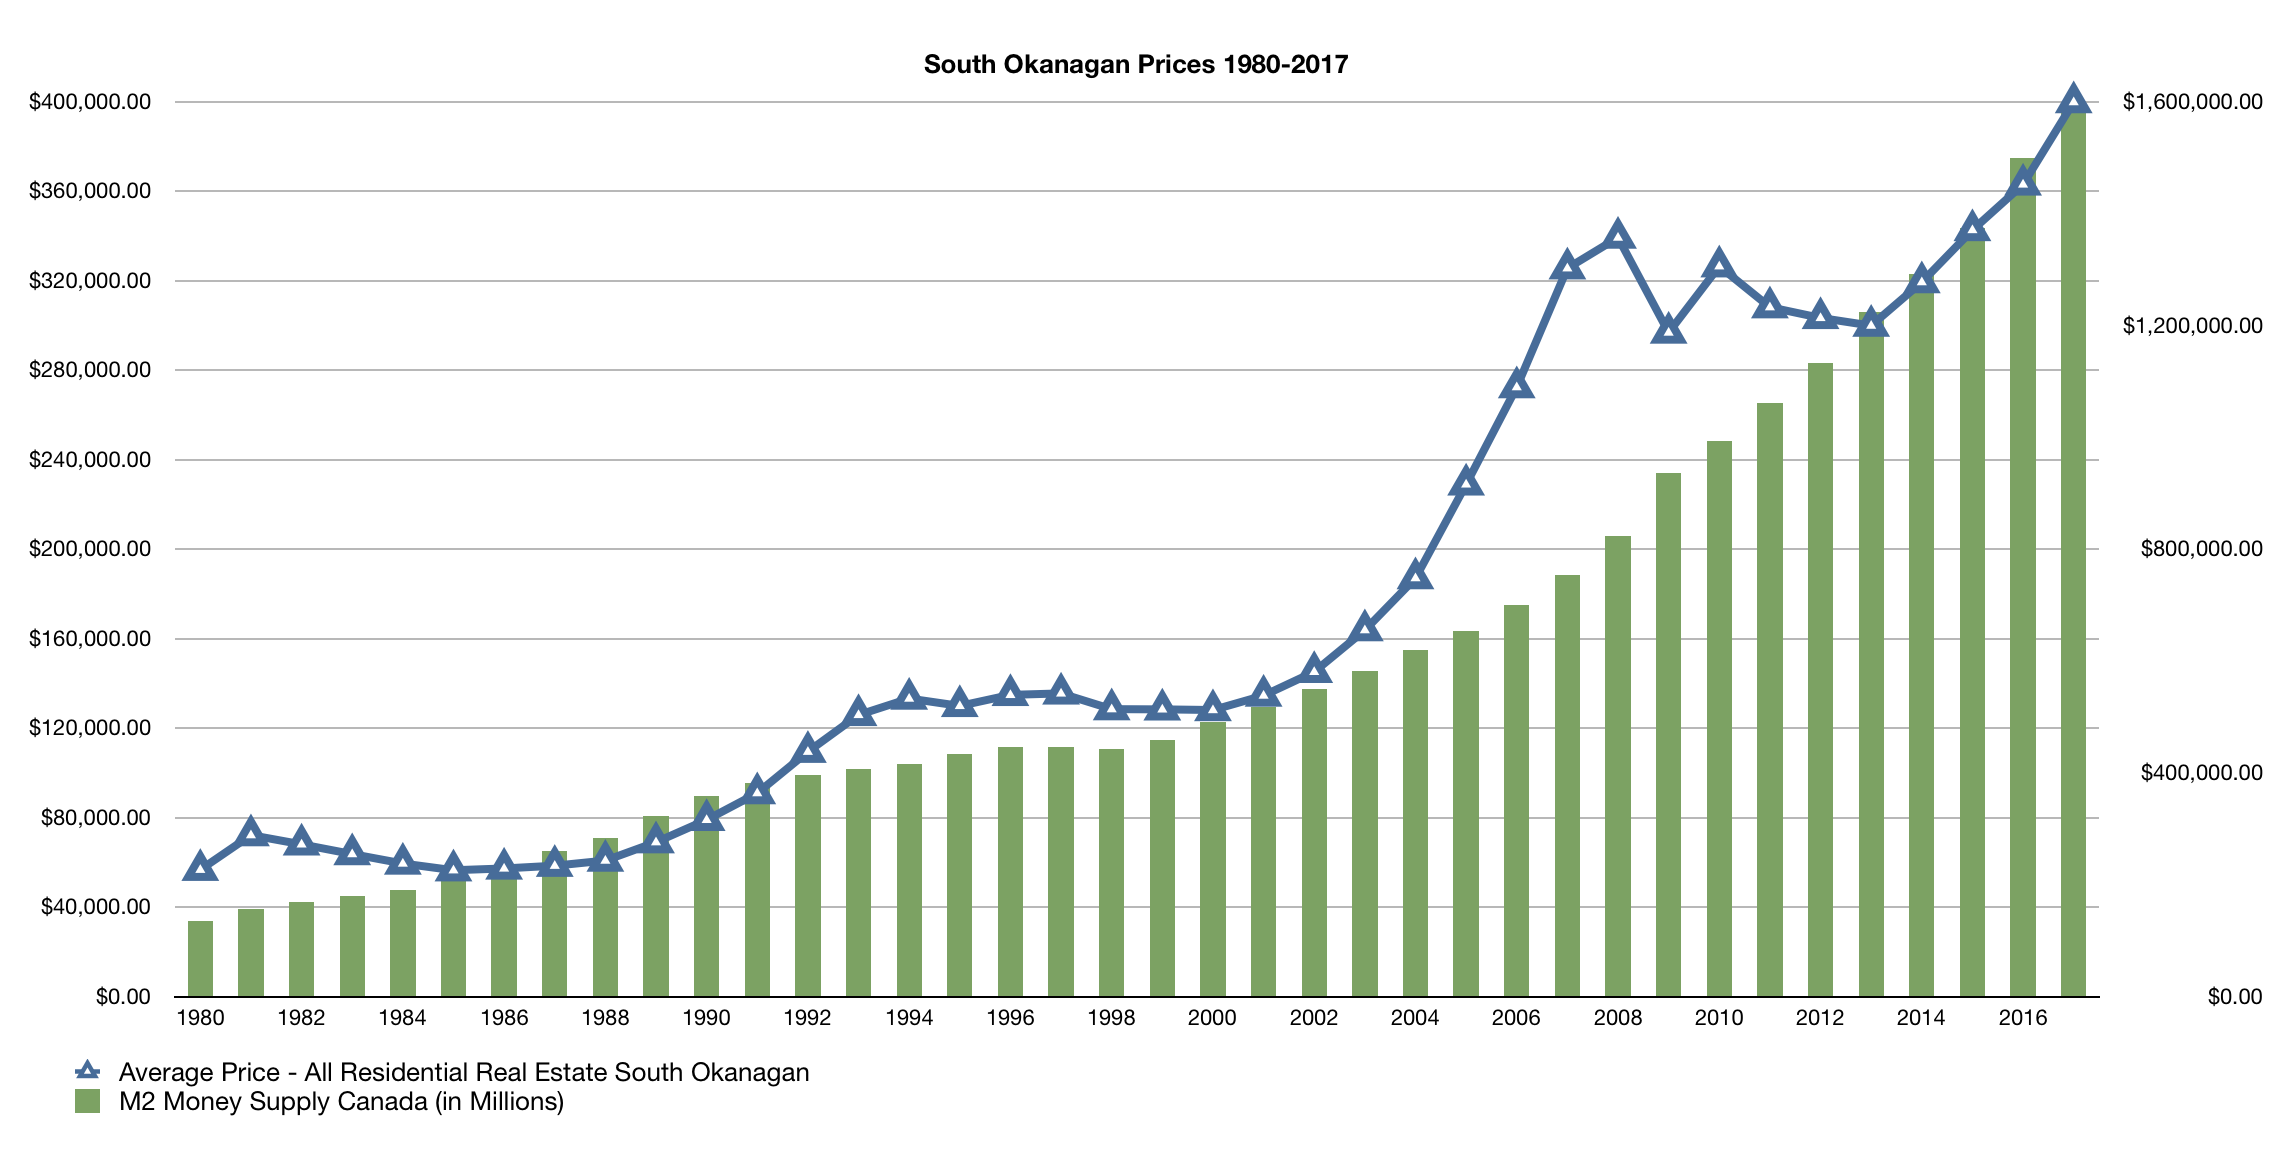
Here are historical real estate prices for the South Okanagan dating back to 1980. It gives perspective to how out of control things got leading up to 2008 & what has ensued since!
Also included in the graph is the M2 money supply of Canada, which is the broadest measurement of money circulating in Canada & a good indicator of inflation. I believe, this tends to correlate well with backstopping real estate prices, as can be seen in the graph. We have advanced significantly from 2013…
I hope you find this informative! (For larger image, right click and select open in new window)