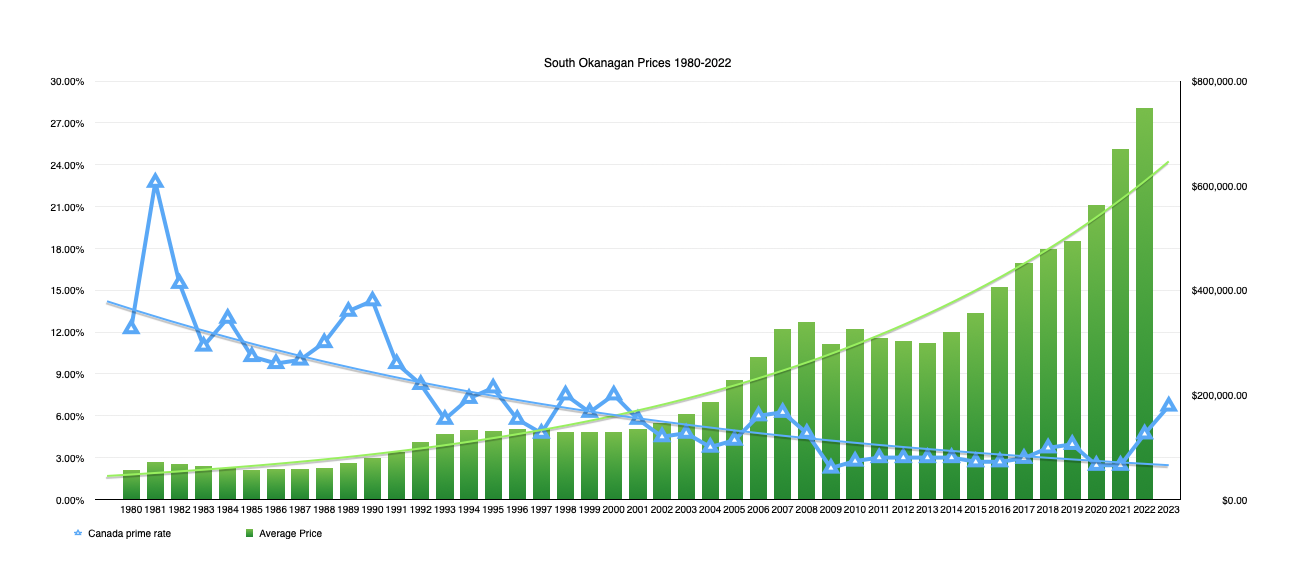
I always find it insightful to look at where we have been. This graph illustrates the interest rate landscape of the past 40+ years. As represented by the prime lending rate.
(right click and select open in new window for a larger image or if on mobile, just zoom in on your screen)
August 13, 2018. The British Columbia Real Estate Association (BCREA) reports that a total of 7,055 residential unit sales were recorded by the Multiple Listing Service® (MLS®) across the province in July, a 23.9 per cent decrease from the same month last year. The average MLS® residential price in BC was $695,990, down 0.4 per cent from July 2017. Total sales dollar volume was $4.9 billion, a 24.2 per cent decline from July 2017.

The BC housing market continues to grapple with the sharp decline in affordability caused by tough new mortgage qualification rules, said Cameron Muir, BCREA Chief Economist. However, less frenetic housing demand has created more balanced market conditions in many regions, leading to fewer multiple offers and more choice for consumers.
Year-to-date, BC residential sales dollar volume was down 18.9 per cent to $37 billion, compared with the same period in 2017. Residential unit sales decreased 20.6 per cent to 50,926 units, while the average MLS® residential price was up 2.1 per cent to $725,639.
Insurance and Wildfires – some information gathered together by BCREA:
As of August 6, more than 300 active fires were burning throughout BC, with evacuation orders and alerts impacting hundreds of properties. From a real estate practice perspective, it’s important for REALTORS® to know what their clients should expect with regard to home insurance for those living in areas affected by wildfire.
First of all, existing insurance policies and renewals aren’t affected.
Second, insurance is for unforeseen events. So, when a client’s home is in an area under evacuation alert or order, it’s fair to expect that new insurance policies are unlikely to be approved until the threat eases. Some insurers may also restrict new policies based on proximity to fires, even when no evacuation orders or alerts are declared. Changes to existing insurance policies, such as requested increases to coverage limits, may also be declined.
Third, insurance for properties in unprotected fire districts is more expensive than in protected fire districts. An unprotected fire district is an area without fire hydrants and a fire department. What can REALTORS® do?
- Buyers who have trouble obtaining insurance should be encouraged to contact several insurance providers, because they have different approaches and criteria.
- Where buyers aren’t able to obtain insurance, they should seek legal advice.
- REALTORS® can help protect homebuyers by using the Subject to Fire/Property Insurance clause developed by the Real Estate Council of BC:
“This offer is subject to the Buyer obtaining approval for fire/property insurance, on terms and at rates, satisfactory to the Buyer, on or before (date). This condition is for the sole benefit of the Buyer.”
- Brokers may also wish to contact their company solicitors for guidance as to how they should deal with this issue.
Additional resources
- FireSmart Manual from the BC Wildfire Service: www.bcwildfire.ca/Prevention/firesmart.htm.
- Tips and information about fire safety from the Insurance Bureau of Canada: www.ibc.ca/bc/disaster/fire.
- Information on evacuation orders and alerts from EmergencyInfoBC: www.emergencyinfobc.gov.bc.ca.
February 7, 2018
The value of building permits grew 27.3% (seasonally adjusted) in December from the previous month. Increases in permits for residential (+50.6) and industrial (+12.8%) projects offset decreases for institutional (‑36.3%) and commercial (‑13.5%) buildings. The value of permits rose in Vancouver (+38.9%), where most of the province’s building activity occurs, while Abbotsford-Mission (+167.1%) and Victoria (+69.2%) both saw large increases as well. Kelowna (‑31.6%) saw a decrease in the value of permits issued.
Nationally, building permits increased by 4.8% in December. There was growth in Saskatchewan (+31.5%), British Columbia (+27.3%), and Quebec (+20.6%). Conversely, the value of permits contracted in Manitoba (‑25.4%), Alberta (‑10.5%), and Atlantic Canada (‑5.4%).
Regional Building Permits
Through December of 2017, the value of building permits issued in the province’s regions climbed 17.5% (unadjusted) above the level recorded in the same period last year. Investment intentions were up in most regions ranging from 7.3% in Kootenay to 156.0% in Nechako. Planned spending rose in Mainland/Southwest (+16.8%), where increases were seen for institutional and governmental (+64.9%), industrial (+60.2%), commercial (+17.2%), and residential (+12.2%) projects. Overall permits continued to increase in North Coast (+79.6%), Thompson/Okanagan (+23.4%), and Vancouver Island/Coast (+22.3%), while the only regions to see declines were Northeast (‑30.3%) and Cariboo (‑9.8%).
Data Source: Statistics Canada (Regional data produced by BC Stats from unpublished data)
Housing starts in urban areas (areas with population of at least 10,000) in British Columbia fell by 26.1% (seasonally adjusted at annual rates) in February compared to January. The decrease was widespread with every housing type start registering declines in the month.
Across British Columbia’s census metropolitan areas, Victoria (+175.5%) was the only one in which housing starts grew in February. Kelowna saw the biggest decrease at 64.5% for the month.
Despite falling in half of the provinces, urban housing starts across Canada went up (+7.1%) in February. The increase was led by Prince Edward Island (+184.6%), Ontario (+25.8%) and Quebec (+17.2%). The increase was concentrated in apartment units (+22.8%) with all other housing types starts declining in the month. Saskatchewan (‑40.0%) registered the largest housing starts decline in February.